Welcome to my monthly real estate newsletter
Greetings! I put out this free emailed newsletter once a month to keep people up to date on the local real estate market. My data focuses on the sales and inventory of homes in New Hanover County, with additional numbers on the region our MLS covers.
To see the full review of real estate sales in the region for 2025, click here.
_____________________________________________________________
| There continues to be signs that the market is slowing, in 2025, the number of homes sold and the average price were up just 3%. But low inventory continues to keep prices moving up. |
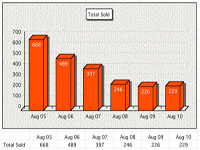
Last month sales New Hanover County
Home sales in June were the highest for the year, but up only marginally from June of last year. In fact, year to date the number of homes sold is in a dead heat with homes sold last year. The brightest spot continues to be high dollar sales, there was a record 50 homes sold priced over $1 million, the most ever for a month.
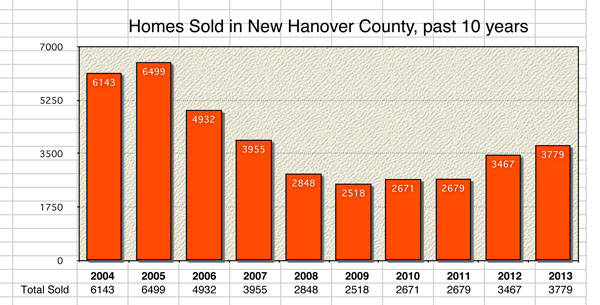
For the year 2025, sales were up 3%. For the year 2024, sales ended up down 1% from 2023. For the year 2023, home sales finished 19% off compared to 2022. Home sales in 2024 were the lowest since 2014.
|
 |
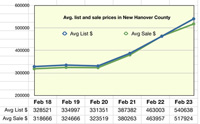
Last month prices New Hanover County--------
Prices dipped to the lowest level in three months, the average sold price came in a around $623k, a whopping 50k drop from last month. The average price per square foot of a sold home was also down, the $305 per was the lowest since February. Compared to June of last year, average prices were down 1%, and the average price per square foot was down 4%.
The average price for sold homes in New Hanover County in 2025 was around $613k and $307 per sq ft. In 2024 it was around 597k and $302 per sq ft. The median sale price in 2025 was $462k, in 2024 it was 452k.
|
 |
Current Inventory ----------
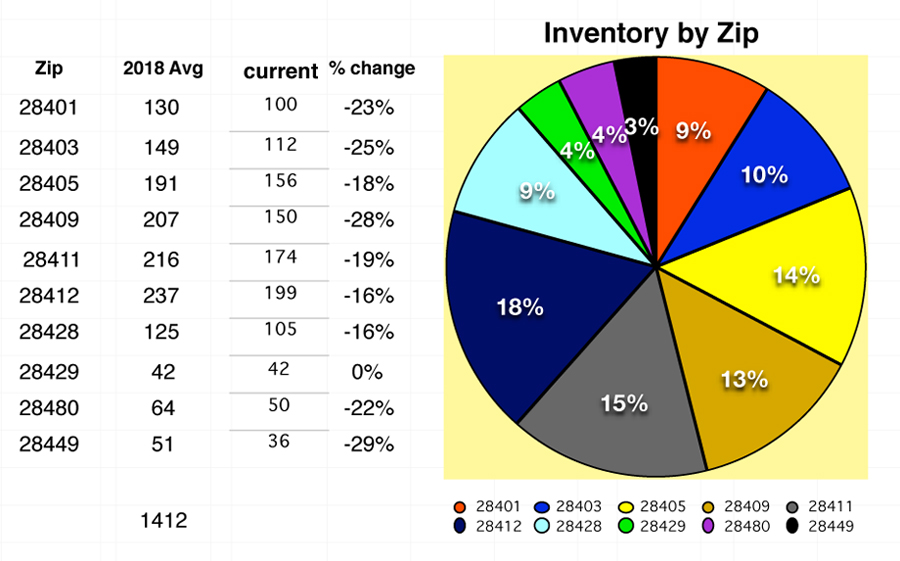
Inventory was up for the fifth straight month, but not by a lot. The 1255 homes for sale in New Hanover County was up 1% from last month, but up 7% from same time last year. Inventory increased the most in Castle Hayne (64%) and Wrightsville Beach (29%). In terms of price range, the biggest increases came in the lowest and highest brackets. Under 300k was up 58% compared to last year's averages, and the over $1 million was up 53% compared to last year's averages.
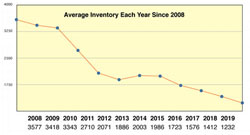
For the year 2025, the average inventory was 1108, compared to 897 in 2024. The average for 2023 was 583, the average for 2022 was 432. So there is clearly an upward trend.
Looking back, inventory in the summer of 2022 was around 500; inventory in 2015 was around 2100; and summer inventory in 2010 was around 3400.
The highest average inventory (since I started looking at it in 2008) was in 2008, when the average was over 3500 homes for sale.
|
 |
High Dollar Properties ----------
Home sales might be down, but the number of homes selling for over a million continue to be up. Last month there were 50 homes sold for over $1 million, and year to date we are up 16%. Meanwhile inventory of $1 million plus homes is up 53% from the average of 2025.
The top sale for the month was a $3.75 million house at Wrightsville Beach. The highest active listing is a $12.5 million house at Figure 8.
See the top listings in New Hanover County here
There have been 11 sales over $10 million in the history of the mls. There have been over 60 sales of over $5 million. Out of the top 20 highest sales, only six happened prior to 2024.
See the top home sales in the HISTORY of New Hanover County here. |
|
|