|
|
--------------------------------------------------------------------------------------------------------------------
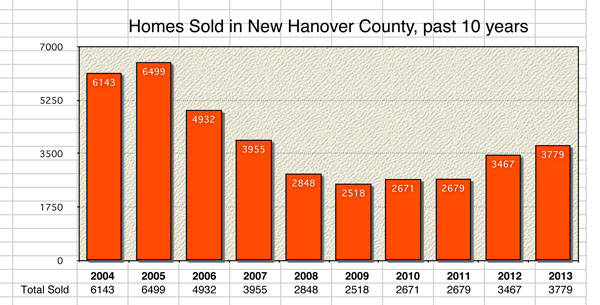
Chart 1.1: Home Sales past 10 years
--------------------------------------------------------------------------------------------------------------------
After a few years of being flat, the number of homes sold in New Hanover County bounced up in 2012 and again in 2013. There were four straight years of declining sales beginning in 2006, and then it hit bottom in 2009. Since then it has been on the rebound, and both 2012 and 2013 have surpassed expectations. |
 |
| |
--------------------------------------------------------------------------------------------------------------------
Chart 1.2: Home Sales 2000-2010 by price category
--------------------------------------------------------------------------------------------------------------------
This chart shows the trends in sales by price category. For example, 39.5% of sales were in the 100 - 199k price range. After gains in recent years, the under 99k price category fell last year to 11.5% of total sales. The 200 - 400k price ranges make up for about 75% of the total market. |
 |
| |
--------------------------------------------------------------------------------------------------------------------
Chart 1.3: Home Sales by Zip Code, past four years
--------------------------------------------------------------------------------------------------------------------
This chart shows the homes sales over the past four years by zip code. The chart shows the past two years, blue represents sales in 2013 and red represents sales in 2012. (the data below it shows all four years). The bottom line shows the percentage difference between 2011 and 2012. Sales in 28401 and 28480 were off 10 - 15%, while sales in 28409 and 28412 were up 22 - 24%. |
 |
| |
--------------------------------------------------------------------------------------------------------------------
Chart 1.4: Total dollar sales volume, past ten years
--------------------------------------------------------------------------------------------------------------------
This chart shows the total sales volume in New Hanover County over the past ten years. The numbers at the bottom are probably too small to read, but the volume peaked at 1,827,915,494 in 2005. We stopped putting a 1 in front of the number in 2008, and in 2011 the total volume was at a ten year low of 661,513,544. Since then it has been moving back up and 2013 is the highest since 2007, and getting really close to getting back into the 10 digit category. |
 |
|